Abstract
There is a growing interest in assessing colour vision and colour vision changes to monitor the early onset of diseases that directly or indirectly cause loss of visual function (see for example, glaucoma and diabetes respectively). The use of colour vision tests is expanding also because of the increasing number of clinical trials and natural history studies. Metropsis offers three different computerised colour vision tests, each of which is best suited for a different patient population, including young children and patients with low vision. All tests are successfully being used in clinical and non-clinical settings for a rapid screening or more in-deep characterisation of colour vision deficiencies (see, for example, Kumaran et al., 2018, Zein et al. 2014).
Keywords: colour vision, color vision, cones, tritan, protan, deutan, confusion axis, cone excitations, cone absorptions, diabetes, glaucoma, retinal degeneration, visual function.
Normal and Defective Colour Vision
Normal colour perception depends on the absorption of light by the three classes of cone photoreceptor in our retina. The peak sensitivities of the three cones lie in the violet, the green and the yellow-green parts of the spectrum – at wavelengths of approximately 420, 530 and 560 nanometres. It is convenient to refer to the three types of cone as short-wavelength, middle-wavelength and long-wavelength sensitive cones, or S-cones, M-cones and L-cones respectively. Their spectral sensitivities are shown schematically in Figure 1.

Any individual cone obeys the Principle of Univariance: although the stimulus for the cone can vary in two dimensions (radiance and wavelength), the output can vary in only one dimension – the degree of hyperpolarization of the cell. As wavelength varies, there is a variation in the probability of a given photon being absorbed, but once a photon has been absorbed, all information about its wavelength or frequency is lost. This means that the individual cone, or class of cones, is colour blind. Lights of two widely different wavelengths will produce the same output providing that the two radiances are suitably adjusted. To analyse colour, the visual system must compare the rates at which quanta are being caught in different classes of cone. This comparison is initiated at a retinal level, in that ganglion cells of the ‘midget’ and the ‘small bistratified’ types draw inputs of different sign from different classes of cone. Thus, lights that produce the same cone excitations will look alike despite their spectral composition.
Dichromacy
Consider a pair of physical stimuli that yield the same quantum catches in the L- and S-cones, but differ with regard to the M-cones. A normal trichromat would be able to discriminate the two lights because of the different responses of the M-cones. However, an individual who lacks M-cones would not be able to make such a discrimination. This is the case of dichromats known as deuteranopes. Individuals who lack L-cones are known as protanopes. About 2% of the male population are congenital dichromats of the deuteranopic or protanopic kinds. Individuals who lack S-cones are known as tritanopes.
Congenital tritanopia, unlike deuteranopia and protanopia, is not sex-linked, and it is much rarer. However, diseases and drugs that affect the receptor layer of the retina appear disproportionately to affect S-cones. The acquired colour deficiency is often of a tritan type, in that thresholds for discrimination are elevated along a tritan confusion line.
Anomalous trichromacy
About 6% of men exhibit anomalous trichromacy, a congenital form of colour deficiency that is milder than dichromacy. Unlike dichromats, they require three variables in colour-matching experiments, but they make different matches from the normal observer and, in most cases, their discrimination of colours is poorer than normal. Currently, the predominant view is that the anomalous trichromat lacks either the normal long-wave or the normal middle-wave pigment, but achieves his residual discrimination in the red-green range by a neural comparison of the quantum catches in two slightly different versions of the middle-wave pigment or two slightly different versions of the long-wave pigment. Anomalous trichromats who behave as if they lack the long-wave pigment are called ‘protanomalous’ and those who behave as if they lack the middle-wave pigment are called ‘deuteranomalous’. Characteristically, the two types of anomalous trichromat show reduced discrimination between chromaticities that are confused by the corresponding type of dichromat: their thresholds, when plotted in a normal colour space, typically form an ellipse oriented along a protan or a deutan confusion line. However, the term ‘anomalous trichromacy’ covers a large variety of phenotypes: some anormals may exhibit discrimination that is nearly as poor as that of the corresponding dichromat, a few enjoy colour discrimination within normal limits, while the majority have discrimination ellipses that lie somewhere between these extremes.
The basis of this phenotypic variation is not yet well understood, but some part of is likely to depend on the spectral separation of the two long-wave or two middle-wave pigments on which the anomal is thought to depend for his residual discrimination. Indeed, the distinction between dichromacy and anomalous trichromacy is nowadays less clear-cut than was traditionally held. For it is possible that some of those classified as dichromats by the Nagel anomaloscope in fact express two genes, encoding pigments with very similar spectral sensitivities, but differing very slightly in peak wavelength or optical density: under some circumstances these residual differences may sustain some limited discrimination in the red-green range.
How can I measure colour vision with Metropsis?
Metropsis offers three colour vision tests: the Cambridge Colour Test (CCT), the low vision version of the Cambridge Colour Test (lvvCCT) and the Universal Colour Discrimination Test (UCDT). All tests aim to screen individuals for colour vision deficiencies; as well as provide more detailed information of changes in colour discrimination that occur as a result of congenital or acquired visual conditions. The clinical investigator will be able to monitor quantitatively the progression or remission of a disease over time. Many drugs affect colour vision, and the pharmacologist will find the tests well suited to monitoring the short-term or long-term course of such side-effects. The Metropsis colour vision tests can also be used to assess the changes in colour discrimination that can occur when wearing tinted lenses.
Cambridge Colour Test
The Cambridge Colour Test provides a rapid means of screening subjects for colour vision deficiencies; but it also can be used to examine in more detail the changes in colour discrimination (Mollon and Reffin, 1989; Reffin et al. 1991; Regan et al. 1994) .
The test combines old principles and modern technology. The stimulus arrays resemble the plates of a traditional pseudoisochromatic test, such as those of Stilling or Ishihara. The target is a C shape differing in chromaticity from the background, as illustrated in Figure 2.

Figure 2. Examples of the C-shape target used in the CCT. The gap in the left stimulus is on the left; the gap in the right stimulus is on the top.
The target and background are made up of many discs, each with a random luminance assigned. Thus, the observer can discriminate the C-shaped target from the background only by true colour vision and cannot use edge artifacts or luminance differences.
During the test, the C-shaped target is presented randomly in one of four orientations, the observer is instructed to press one of four corresponding keys. So the subject cannot predict the identity of the target on a given trial and thus can be tested repeatedly.
The advantage of computer control is that the difference in chromaticity between target and background can be adjusted dynamically according to the subject’s performance. At the beginning of the test run, the target is saturated in colour; a staircase routine is then used to establish the chromaticity difference needed for the subject reliably to report the orientation of the C. In the basic “Trivector” version of the test, the targets differ from the background along the protan, deutan and tritan confusion lines. These three types of target probe the sensitivity of the L-, M- and S-cones respectively. The Trivector version takes approximately 4-5 minutes to complete.

The longer version of the test yields a full ‘discrimination ellipse’, showing the loss of sensitivity for a range of directions around the background chromaticity: in the common forms of colour deficiency, the long axis of the discrimination ellipse is indicative of the type of loss. The examiner can choose to run the Ellipse version using 10 or 20 directions, each taking approximately 8 or 15 minutes to complete.

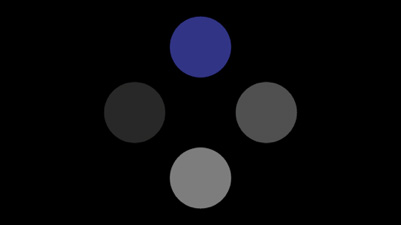
Low-vision version of the Cambridge Colour test
The low-vision version of the Cambridge Colour Test (lvvCCT) measures chromatic discrimination using the procedure described in Simunovic et al. (1998, VR 38 3413-19). This test is more appropriate for observers with low vision, as it uses a larger stimulus that can be seen even by people with low vision. In its underlying principles, the lvvCCT resembles the original CCT introduced above. The main difference is in the stimulus used, which consists of four homogeneous discs, one of which differs in chromaticity from the remaining three (which remain of neutral hue).
Universal Colour Discrimination Test
The Universal Colour Discrimination Test (UCDT) is a colour discrimination test suitable for a wide range of subjects, including children (tested from the age of 5), adults with normal or affected vision, including low vision. The test was developed by Ripamonti et al. (2014) originally using the ViSaGe visual stimulus generator. However, the current Metropsis implementation is functionally identical to the original test.
How do the tests work?
Each colour vision test comes in two version: a screening version (Trivector) and a full-version (Ellipse version), each lasting 4-5 minutes or 8-12 minutes, respectively.
When the investigator launches the test from the Metropsis App, Metropsis automatically presents a series of calibrated coloured images onto the CRS Display++ monitor. This monitor uses a unique integrated sensor system, which enables the display to self-calibrate itself in real time. This guarantees that the test images are always reproduced with the maximum accuracy across the various testing sessions as well as across systems installed at different sites.

During the test, a quick adaptive procedure randomly presents the coloured image in the centre of the screen. For the lvvCCT test illustrated in Figure 7, the observer is instructed to report the position of the disc that differs from the others in colour by pressing either of four keys on the provided response box.

If the observer answers correctly, on the next presentation the saturation of the stimulus decreases; if the observer answers incorrectly, the saturation increases. This procedure is designed to find the minimum saturation required to discriminate the target against the luminance noise.
This adaptive procedure continues until a saturation threshold is found for each colour direction.
During the experiment, the examiner can monitor the performance on the subject from the Metropsis App.

As soon as the test terminates, the results are immediately available on the Metropsis App in a table format and in a graphical representation (Figure 10).

Why are the Metropsis colour Vision tests better than other commercially available tests?
- Many pseudoisochromatic plate tests use alphanumeric characters, and these have the difficulty that the subject may be rehearsed on the test in advance or may remember responses from previous testing.
- The task itself is cognitively simple and is readily grasped by subjects, including 5-year-old children.
- The advantage of computer control is that the difference in chromaticity between target and background can be adjusted dynamically according to the subject’s performance.
- Metropsis colour vision tests are highly sensitive to small changes in colour discrimination, which can be used to monitor changes in visual conditions that can appear before anatomical of physiological changes.
- Metropsis colour vision tests have been developed to accommodate the different visual capabilities of normal, defective, paediatric, aging and low-vision populations.
- Metropsis colour vision tests Metropsis has been designed to be extremely user-friendly and thus suitable for clinical trials or natural history studies carried out in different sites.
- Metropsis uses custom-designed display technology to deliver accurate visual stimuli. It provides very fine control of colour and contrast, which allows the examiner to detect subtle changes in visual functions.
References
Reffin, J. P., Astell S. and Mollon, J. D. (1991) Trials of a computer-controlled colour vision test that preserves the advantages of pseudoisochromatic plates. In Colour Vision Deficiencies X, pp 69-76, Eds: Drum, B., Moreland, J. D. and Serra, A., Kluwer, Dordrecht.
Regan, B. C., Reffin, J. P. and Mollon, J. D. (1994) Luminance noise and the rapid determination of discrimination ellipses in colour deficiency. Vision Research, 34, 1279- 1299.
Jolly JK, Pratt L, More AK, Kwan J, Jones RL, MacLaren RE, Aslam S. (2022) The Effect of Cataract on Color Vision Measurement with the Low-Vision Cambridge Colour Test: Providing an Adjustment Factor for Clinical Trials. Ophthalmol Sci. 2(2):100153.
Jolly J.K., Bridge H., MacLaren R.E. (2019) Outcome measures used in ocular gene therapy trials: a scoping review of current practice. Frontiers in Pharmacology 10(1076).
Jolly J.K., Simunovic M.P., Dubis A.M., et al. (2021) Structural and functional characteristics of color vision changes in choroideremia. Frontiers in Neuroscience. 15(729807).
Motz, C.T.Chesler Allen Bales MeesFeolaMaa OlsonThule IuvoneHendrickPardue, M. T.(202) Novel Detection and Restorative Levodopa Treatment for Preclinical Diabetic Retinopathy. Diabetes, 69 (7): 1518–1527.
Georgiou, M., Singh, N., Kane, T., Robson, A.G., Kalitzeos, A., Hirji, N., Webster, A.R., Dubra, A., Carroll, J., Michaelides, M. (2020) Photoreceptor Structure in GNAT2-Associated Achromatopsia. Invest. Ophthalmol. Vis. Sci., Vol.61, 40.