Visual acuity represents the ability to detect fine details of a stimulus presented foveally. This ability can be assessed in different ways and by using different stimuli, such as rings, gratings, or letters. These stimuli are typically characterised by a high luminance contrast and spatial frequency content.
Visual acuity measurements are directly associated with the quality and integrity of the optical media of the eye; hence they are used to:
- Quantify refractive errors.
- Evaluate the efficacy of corrected refractive error methods, such as spectacles, contact lenses, or surgical corrections.
- Provide a quick screening of the presence of ocular abnormalities.
- Monitor consequences of a disease, its course and/or its treatment.
- Test an individual’s ability to perform tasks which involve good resolution, such as reading small print.
Visual acuity measurements are also used to assess disorders not necessarily linked to the quality of the ocular media. For example, they can be used to:
- Detect amblyopia and monitor changes due to related visual training
- Monitor the progression of a disease or the effect of a clinical intervention.
What is the best way to measure visual acuity?
The best way to measure visual acuity depends on a number of factors, including the age of the observer, the time available and the purpose of the examination.
For example, ETDRS charts are recommended for a quick and easy screening of visual acuity. However, when monitoring small changes caused by the progression of a disease or the effect of treatment, investigators usually find that the step size between the chart lines is too coarse to reveal small variations. In these cases, it is better to use tests based on adaptive procedures in which the size of the optotype is continuously adjusted as a consequence of the observer’s performance.
Metropsis offers a number of far and near visual acuity tests suitable for assessing recognition acuity or resolution acuity.
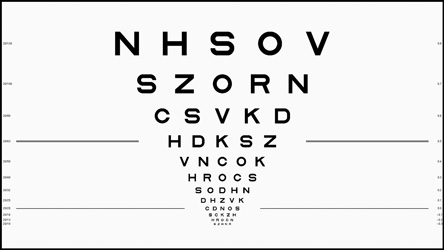
Recognition acuity measures the correct identification of a target. For this purpose, Metropsis uses Sloan letters forming the Early Treatment of Diabetic Retinopathy Study (ETDRS) charts.
Resolution acuity measures the smallest spatial detail that can be resolved within a target. For this application, Metropsis uses the Landolt ring (aka Landolt C) to measure the smallest gap that the observer can resolve. The Landolt ring can be presented in isolation or surrounded by crowding bars, which make the test ideal for assessing visual acuity in amblyopic eyes.


As resolution acuity tests are based on adaptive procedures, the final score is a much closer estimate of the observer’s visual acuity thresholds.
How can I measure visual acuity with Metropsis?
ETDRS charts
The test aims to measure the minimum angle of resolution using electronic ETDRS charts viewed at a distance of 4m. These charts have been implemented using the recommendations reported in Ferris et al. (1982)1. The examiner initiates the test from a control monitor and the charts appear on the calibrated CRS Display++ monitor.
When the test is launched, the investigator enters information about subject, eye examined, testing conditions (for example, presence of glare source), etc. This information is stored electronically in a database which can be accessed at any time. As soon as the subject is in position and ready to start, an electronic chart appears on the calibrated monitor and a similar distribution of letters is displayed on the examiner’s monitor.

The subject is instructed to read out loud the letters on the chart, while the examiner marks those letters read incorrectly on the control monitor. This information will also be stored electronically allowing the investigator to review it at a later stage. The test will return the mean visual acuity calculated across all the charts presented.
Landolt C or other optotypes
The test aims to measure the minimum angle of resolution by using a Landolt C presented in isolation, or surrounded by crowding bars. The optotype appears in the centre of the screen in one of four orientations and gradually changes its size according to the observer’s performance. The observer is instructed to indicate the perceived position of the optotype’s gap and press the corresponding button on a response box (the button arrangement on the box matches the spatial configuration of the stimulus). If the observer answers correctly, the size decreases, if they answer incorrectly it increases.
Compared to using ETDRS charts, a test based on an adaptive procedure provides a more accurate estimate of visual acuity, which allows investigators to monitor small changes in the resolution ability. Adaptive procedures may also be applied to different optotypes, such as T, O, V, H. However, it is recommended to use the Landolt C when testing illiterate observers and pre-readers, or to avoid the criticism that some letters are harder to distinguish than others.

Why is Metropsis better than other systems for measuring visual acuity?
- Printed visual acuity charts can degrade over time, whereas electronic charts do not.
- Stimuli are presented on a calibrated and spatially uniform CRS Display++ monitor.
- Metropsis charts automatically present stimuli in a randomised order. This process is faster than the manual selection used with printed charts.
- Metropsis visual acuity tests offer a wider range of optotype configurations (single optotypes, optotypes with crowding bars, charts).
- The results are automatically saved in electronic format or immediately available to be printed or emailed. The files are neatly organised per observer, group, and study.
- These automatic procedures reduce testing time, operator’s biases or mistakes which may occur during the scoring or filing process.
- All the default test protocols are pre-set and locked for quick and easy testing; however, the psychophysical method as well as the stimulus parameters are highly configurable, and can be unlocked for investigators to modify themselves.
- Visual acuity can be measured under glare conditions.