Contrast sensitivity is a measure of the amount of contrast required to detect or discriminate an object.
The assessment of spatial vision is informative for a number of reasons:
- Contrast sensitivity function (CSF) is more informative than visual acuity in describing an observer’s spatial vision abilities.
- Contrast sensitivity shows a high correlation with daily activities, such as reading, searching and recognising objects, navigating through a maze.
- The shape of the CSF can be indicative of underlying visual conditions, such as age-related macular degeneration, glaucoma, amblyopia, and most cone-rod dystrophies.
- Contrast sensitivity tests are not limited to central vision and can be used to detect and monitor disorders that affect peripheral vision.
How can I measure spatial contrast sensitivity?
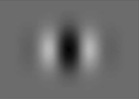
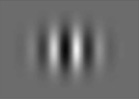
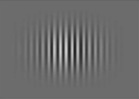
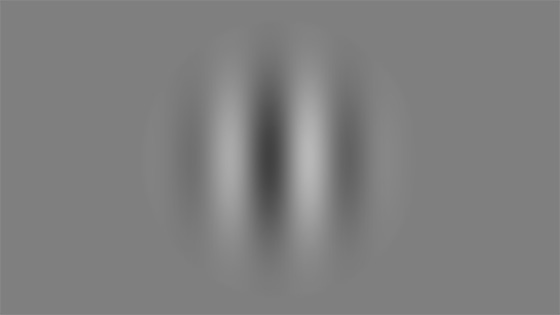
Spatial contrast sensitivity has traditionally been measured using sinusoidal gratings of different spatial frequency, like the ones showed in Figure 1. The adoption of these patterns follows the discovery of cortical neurons involved in the early stages of the visual processing which are optimally “tuned” to such patterns.
Metropsis allows investigators to measure contrast sensitivity by presenting a test pattern and repeatedly adjusting the contrast until it is just visible. In simple terms, the contrast represents the brightness difference between the dark and bright bars of the grating. Figure 2 shows an example of two gratings with different contrast.
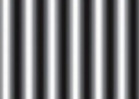
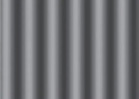
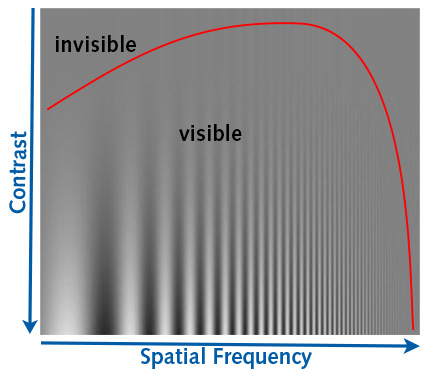
Figure 3 shows a typical contrast sensitivity function (red line) measured with Metropsis in an adult with normal vision. The contrast sensitivity function has been plotted approximately in correspondence of the subject’s contrast threshold.
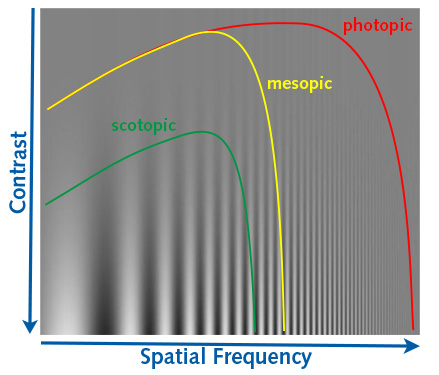
The CSF varies with changes in light levels (see Figure 4) and with age1,2. However, the rate of change due to aging is different across light levels, as the mesopic CSF starts to decline in the 50s well before the photopic CSF. This could be due to the age-related reduction in the number of rods in the parafovea3,4, which is more severe in cases of AMD5.
How can I measure contrast sensitivity with Metropsis?
Metropsis provides two contrast sensitivity tests which are designed to measure a complete CSF using either a staircase procedure or a quick Bayesian approach.
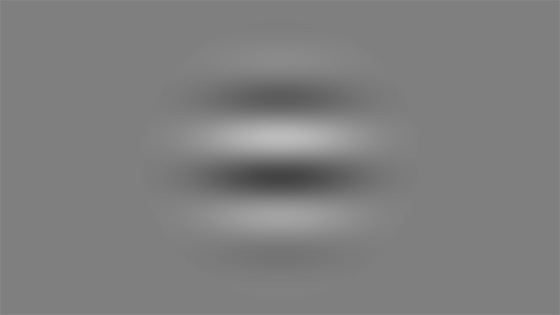
The examiner launches the CSF test from the Metropsis GUI, and a series of gratings is presented on the calibrated CRS Display++ monitor. The grating is displayed in the centre of the screen (Figure 5) at different spatial frequencies

During the test, a quick adaptive procedure randomly presents the grating in a vertical or a horizontal orientation. The subject is instructed to report the orientation of the grating by pressing either of two keys on the response box.

If the subject answers correctly, on the next presentation the grating contrast decreases; if the subject answers incorrectly, the grating contrast increases. This procedure is designed to find the minimum contrast required to discriminate the orientation of the grating.
This adaptive procedure continues until a contrast threshold is found for each spatial frequency. During the experiment, the examiner can monitor the performance of the subject from the Metropsis GUI.

Metropsis offers a quick and reliable test for measuring contrast sensitivity over a large range of spatial frequencies. The higher the number of spatial frequencies used, the more accurate the estimate of the CSF peak and cut-off frequency.
As soon as the test terminates, results are immediately available in a test Report file. Figure 9 shows results collected with the staircase method and Figure 10 shows results collected with the Bayesian method.


Measuring the CSF at different light levels
It has been demonstrated that the contrast sensitivity function of AMD patients is significantly depressed at mid-to-high spatial frequencies. This sensitivity is even more reduced at dim light levels.
Metropsis can measure the CSF at photopic, mesopic and scotopic light levels. The lower light levels are achieved by simply adjusting the wide dynamic range backlight of the CRS Display++ monitor without the need for neutral density filters.
At photopic light levels, rods are saturated or desensitised, thus the CSF measurements represent primarily the sensitivity of cones. Conversely, cones are insensitive at scotopic light levels, and thus at these levels the CSF is uniquely due to rods. At mesopic light levels, both rods and cones contribute to the CSF. In summary, by measuring the CSF at different light levels it is possible to isolate and characterise responses of different classes of photoreceptor.
Can I measure the CSF in young children?
Metropsis contrast sensitivity tests use non-invasive psychophysical methods to assess contrast sensitivity. According to these methods, a stimulus is displayed onto the screen and the subject is instructed to perform a visual task that will reflect how well they see the stimulus. In particular, subjects will report whether a grating is oriented vertically or horizontally by pressing either of two keys on a response box.

The task is very simple and can be performed by children as young as 5. During the test, children are allowed to take breaks, if necessary.
Go to more information on the visual assessment in children using Metropsis.
Can I measure the CSF with the Pelli-Robson charts?
Metropsis can measure contrast sensitivity with electronic versions of the Pelli-Robson charts, as illustrated in Figure 12.

There are several advantages of using the electronic charts over printed charts:
1) Each chart is quickly presented and the letters’ order is automatically randomised.
2) The examiner scores the answers electronically to reduce possible errors.
Measuring the CSF in other ophthalmic conditions
Metropsis contrast sensitivity tests can also be used in other ophthalmic conditions including myopia, cataract, ocular scatter, age-related macular degeneration, ocular hypertension, glaucoma and dry eye. A loss in contrast sensitivity has also been found in some neurological conditions, such as: multiple sclerosis, Parkinson’s disease, cerebral lesions, and schizophrenia. There is also evidence of a decrease in contrast sensitivity as a side effect of prescription drugs.
Studies that have used Metropsis
See References 6-8 for represented studies that have used Metropsis.
References
2Ross JE, Clarke DD, Bron AJ. Effect of age on contrast sensitivity function: uniocular and binocular findings. Br J Ophthalmol. 1985; 69: 51–56.
3Curcio CA, Millican CL, Allen KA, Kalina RE. Aging of the human photoreceptor mosaic: evidence for selective vulnerability of rods in central retina. Invest Ophthalmol Vis Sci. 1993; 34: 3278–3296.
4Gao H, Hollyfield JG. Aging of the human retina. differential loss of neurons and retinal pigment epithelial cells. Invest Ophthalmol Vis Sci. 1992; 33: 1–17.
5Curcio CA, Medeiros NE, Millican CL. Photoreceptor loss in age-related macular degeneration. Invest Ophthalmol Vis Sci. 1996; 37; 1236–1249.
6Fernandes TP, de Almeida NL, Butler PD, Santos NA.(2019) Spatial contrast sensitivity: effects of reliability, test-retest repeatability and sample size using the Metropsis software. Eye (Lond). 33(10):1649-1657.
7Cara T. Motz, Kyle C. Chesler, Rachael S. Allen, Katie L. Bales, Lukas M. Mees, Andrew J. Feola, April Y. Maa, Darin E. Olson, Peter M. Thule, P. Michael Iuvone, Andrew M. Hendrick, Machelle T. Pardue. (2020) Novel Detection and Restorative Levodopa Treatment for Preclinical Diabetic Retinopathy. Diabetes. 69 (7): 1518–1527.
8Domínguez-Vicent A, Helghe E, Wahlberg Ramsay M and Venkataraman AP (2021) Photopic and Mesopic Contrast Sensitivity Function in the Presence of Glare and the Effect of Filters in Young Healthy Adults. Front. Psychol. 12:772661.